Setting up graphic reports with Content Statistics
If you have Content Statistics installed in your site (sold separately), you can use it to create beautiful graphic charts for your Paper Shape area.
First of all, if you have never used Content Statistics, we strongly recommend you to read the Content Statistics documentation. The necessary ones are the Installation and Creating your first graphic statistics module. These two manuals show step by step how to display a graphic.
Now that you have an idea of how graphics modules are displayed, let's see how to display a graphic for the Paper Shape component.
First of all, you need to download the Extension Paper Shape plg_contentstats_com_papershape_X.X.X_X.X.zip from the download files for Content Statistics and install it through the Joomla extension manager.
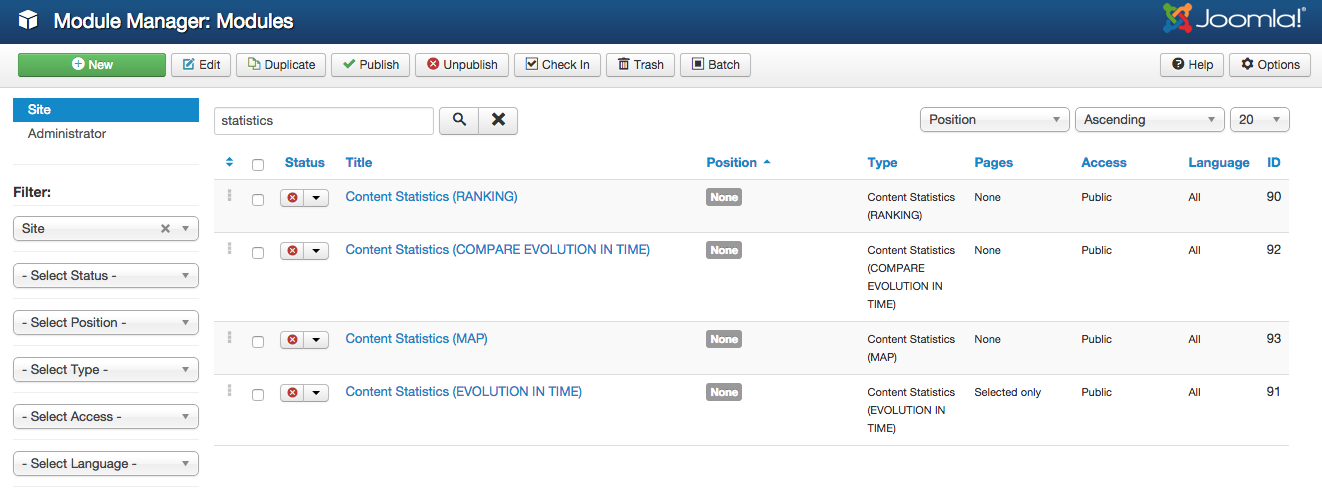
At this point, going to Joomla module manager, you should see the modules you have installed for Content Statistics. For example the image shows all the modules installed:
Remember that Paper Shape is mostly a backend component and the modules you want are in the Administrator section.

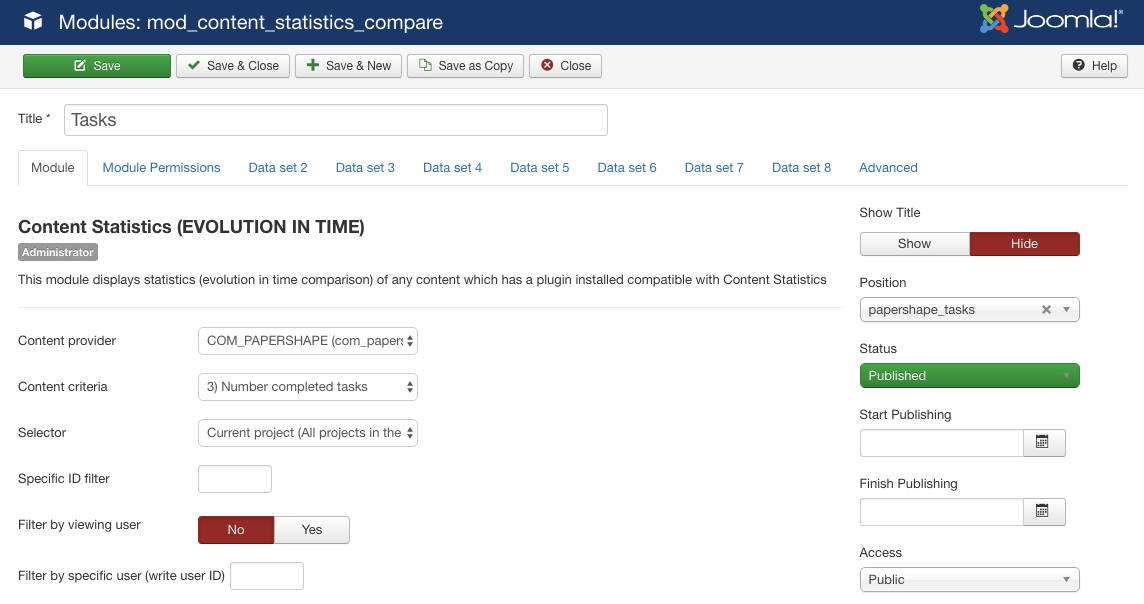
Let's configure for example the Content Statistics module. We click on it to edit the settings. The particularity here, are the module positions. There are several module positions created inside the main Paper Shape view:
- papershape_main_top: this position is situated on the top of the dashboard view over the new log bar.
- papershape_project_info: this position is in the single project dasboard, above the project details.
- papershape_timelogs: this position is situated inside the logs card, over the logs list.
- papershape_tasks: this position is situated inside the tasks card, over the tasks list.
- papershape_reports_top: this position is situated on the top of the reports view.
- papershape_reports_left: this position is situated below the big information boxes of the reports view. On the left side.
- papershape_reports_right: this position is situated below the big information boxes of the reports view. On the right side.
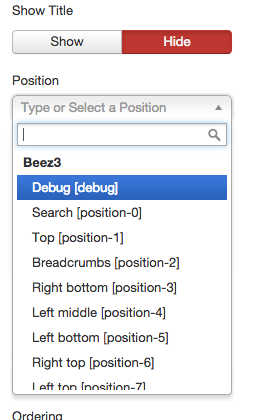
To select one of them, all you need to do is to open the position dropdown:

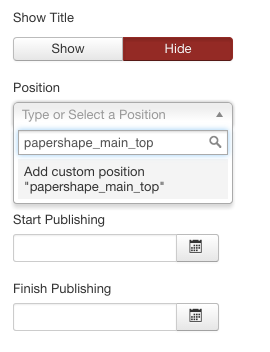
And there you need to type one of the four module positions above. Note that they won't appear in the list.


In oreder to choose which information you want to display, you need to choose the Content Criteria and the Selector in this module. There are several options shuch as Number of hours, number of logs, number of completed tasks...
Finally, note that if you want the graphics to be readjusted when applying a filter, you will need to select the AJAX option for the Layout field